
Help centerDashboard and lifetime valueReading the Overview
Reading the Overview
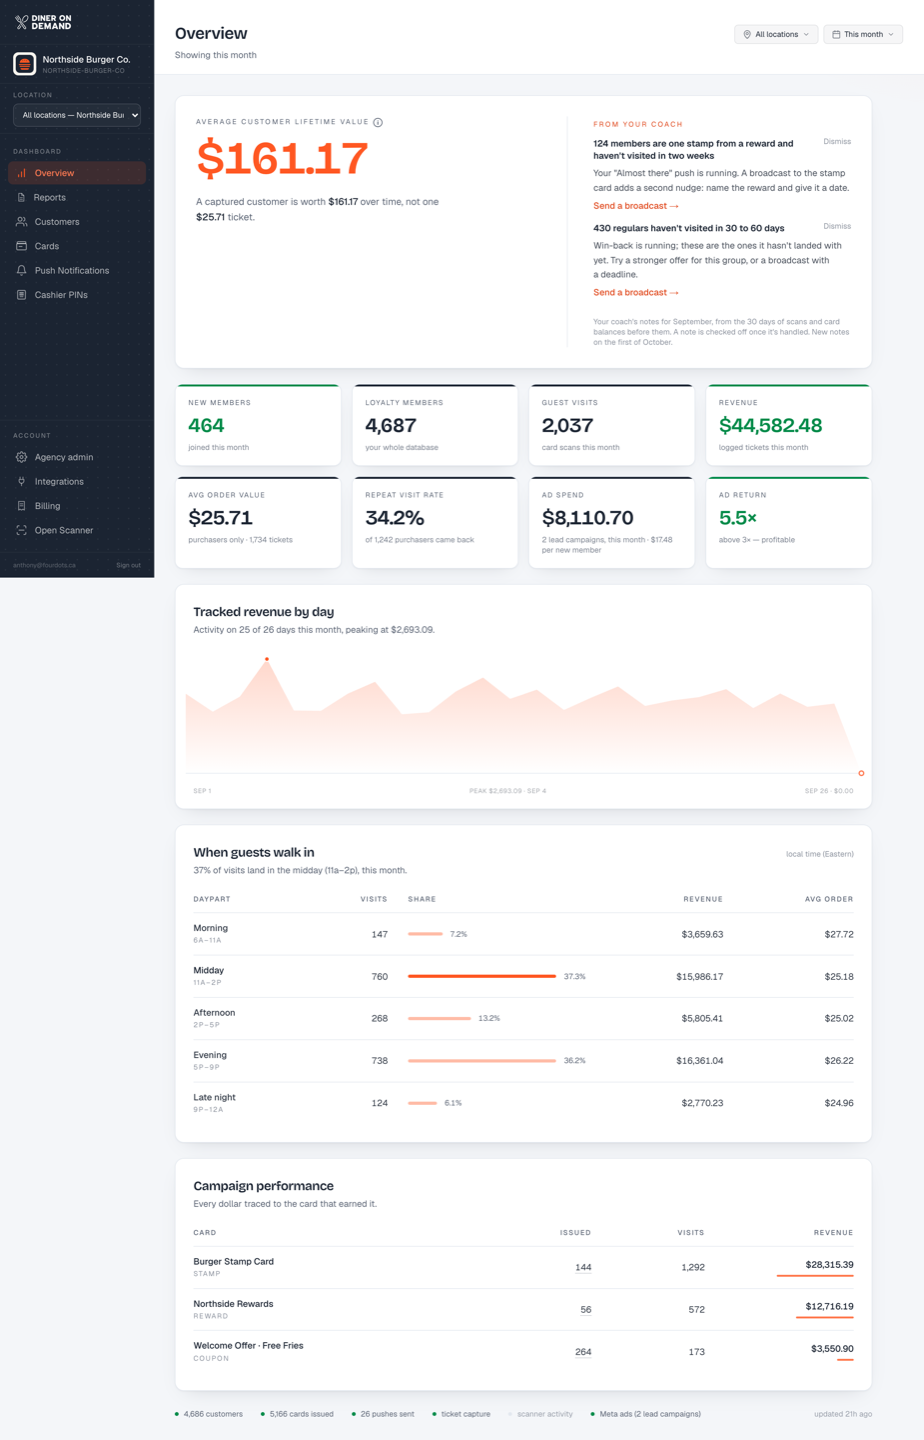
The Overview answers one question: what is a captured customer worth to us? Everything on the page is built from real scans at your counter, so the numbers only move when a card is scanned and a ticket amount is entered.
Filters
Two pickers at the top right control the whole page.
- Location. All locations, or one store. Single-location businesses don't see this.
- Period. This month, last month, or a longer range. Most tiles read "this month" so you can compare like with like.
The tiles
| Tile | What it counts |
|---|---|
| Average customer lifetime value | What a member is worth over their whole relationship with you, not one ticket. See Customer lifetime value. |
| New members | Guests who joined in the period. |
| Loyalty members | Your whole database, everyone who has ever taken a card. |
| Guest visits | Card scans in the period. One scan is one visit. |
| Revenue | The ticket amounts your team entered at the scanner, added up. |
| Avg order value | Revenue divided by tickets, counting only visits where a ticket was entered. |
| Repeat visit rate | Of the guests who bought in the period, the share who came back at least once. |
| Ad spend | What your Meta lead campaigns spent, and the cost per new member. Only shows once Meta is connected. |
| Cost per new member | Your customer acquisition cost (CAC): lead-ad spend divided by new members this period. The note under it says how many times over a member pays that back at your lifetime value. Three times or better is a healthy campaign. |
Below the tiles
- Tracked revenue by day. A day-by-day line for the period, with the peak day called out.
- When guests walk in. Visits, revenue and average order by daypart, in store time: the clock at the store where each visit was scanned.
- Campaign performance. Every card, with cards issued, visits and revenue traced back to it. This is how you see which offer actually pays.
See Revenue, dayparts and campaigns for how to read each one.
The footer
The strip at the very bottom shows what's feeding the page: customers, cards issued, pushes sent, whether ticket capture and scanner activity are healthy, and when the data was last updated. A grey dot means that source hasn't reported recently.
Still stuck? Email support@dinerondemand.com.